Multi-Platform Mastermind
  • Home
  • Industry News
  • Technology Guide
  • Blog
  • Research & Whitepapers
  • Products & Services
  • About
    • About
    • Contact Us

Instagram Usage in the US Surges 35% in 2013, Rivals Twitter for Smartphone Audience

3/31/2014

0 Comments

 
Picture
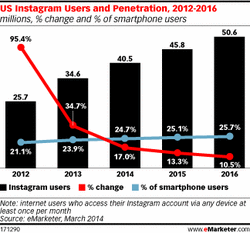
User counts among millennials and Gen Xers are nearly equal on both sites Just how many people in the US use Instagram, the photo- and video-sharing service Facebook acquired in 2012? According to new figures from eMarketer, Instagram usage in the US has ramped up rapidly and is already maturing, reaching regular usage levels nearly matching Twitter’s, particularly on smartphones and among millennials and Gen Xers.

Nearly 35 million people in the US accessed Instagram at least once per month in 2013, according to eMarketer’s latest forecast—representing double-digit but not spectacular growth over 2012. By the end of this year, almost 25% of US smartphone users will snap a photo, slap on a filter and share their creations with friends on Instagram on a monthly basis (or, at least, sign in and check out what their friends are posting).

User counts for Instagram and Twitter are strikingly similar. eMarketer estimates that 43.2 million US consumers used Twitter monthly last year—or 17.6% of the total internet user population. Meanwhile, Instagram users represented 16.1% internet users. Limiting that figure to smartphone Twitter users, Twitter hit just 30.8 million in 2013; this will increase to 37.3 million in 2014, or 22.7% of US smartphone users. Both figures fall slightly below those for total Instagram users, and while Instagram activity all but exclusively takes place on smartphones (meaning Instagram’s smartphone user base could be higher than Twitter’s), it is possible for Instagram users to have an account online without accessing the service through a smartphone. As a point of reference, eMarketer pegs US smartphone Facebook users at 123.7 million this year.

Twitter’s US user base shows signs of maturing in its demographic composition, spreading the user population more evenly across age groups, while Instagram is still largely limited to a pool of millennial and Gen X users. Last year, 69.0% of Instagram’s users were ages 18 to 44. This year, that figure will drop, but only to 67.5%, and over time, Instagram’s user base in these age groups will approach, but not surpass, Twitter’s. eMarketer does not expect significant shifts in usage by age for either site within our forecast period, and Instagram’s user count among 18- to 44-year-olds will remain about 1 million fewer than Twitter’s in each year throughout our forecast.

One demographic shift well under way for Instagram, however, is an evening out in terms of gender. In 2012, about two-thirds of Instagram users were female. While women still make up the majority of users, by 2016 the ratio is expected to reach 55% female vs. 45% male.

eMarketer bases all of our forecasts on a multipronged approach that focuses on both worldwide and local trends in the economy, technology and population, along with company-, product-, country- and demographic-specific trends, and trends in specific consumer behaviors. We analyze quantitative and qualitative data from a variety of research firms, government agencies, media outlets and company reports, weighting each piece of information based on methodology and soundness.

0 Comments

Capitalizing On The Growth, Cost Benefits of Cable's Long Tail

2/21/2014

0 Comments

 
Picture
by Liz Janneman

For decades, the cable industry faced an uphill battle — convincing advertisers and ad agencies alike to “follow the viewers” and allocate their media budget accordingly.  The battle cry from cable networks was to “stop paying more for less," to realign advertising strategies with consumer viewing habits by shifting money from broadcast to cable.

Cable’s battle cry was heard, and the shift of ad dollars to cable gained momentum.  Cable networks could now capitalize on the development of two significant revenue streams and, as a result, the top-tier of those networks made substantial investments in original programming.  

Fast-forward to today: We see incredible original cable show successes, including AMC's "The Walking Dead" and A&E's "Duck Dynasty."  Given the emergence of such hits, top-tier cable networks now can truly position themselves as a legitimate "broadcast replacement."  Interestingly, the early buzz around this year's upfront is the "topping out" of broadcast dollars and the subsequent shift of funds to cable, where overall viewership continues to climb.

But top-tier cable networks’ successes come at a price; one passed along to advertisers. Why? Because the overall cable viewership growth is not being driven by the top 10, 20 or even 25 cable networks.  In fact, the growth in cable is being driven by the bottom 25 networks.  

You read that right. The bottom 25 cable networks are experiencing the most growth.  Yet despite that fact, nearly two-thirds of all cable advertising dollars goes to the top 25 networks.  All of this is happening as the top-tier cable networks shout for pricing parity for those hit shows they consider a true alternative to prime-time broadcast shows.  

It is a plan that they have attempted to implement in past upfronts, and its continuance has already become a point of contention between some top-tier networks and the buying community for the 2013-14 upfront.  A media executive was recently quoted in the press as saying..."That's asking us to pay a lot more for cable and I'm not sure advertisers will tolerate that."

Ironically, the top-tier cable networks' quest to become an alternative to broadcast has led them to face the same challenges broadcasters faced when cable was becoming a real competitor.  How do they convince advertisers to put more money toward diminishing ratings and, in many cases, pay higher CPMs than the marketplace conditions seem to allow?  At what point will advertisers fight back and find relief in the up-and-coming tier of cable networks experiencing tremendous ratings growth? These offer a much more affordable alternative.

I am not discounting the need to reach as large an audience as possible as an essential part of any media plan, but if the top-tier networks seek to push their pricing parity initiative amid a falling ratings trend, advertisers will be placing a disproportionate amount of dollars on a weakening commodity.  

Now is the time to start building the relationships with the sector of the marketplace that is the growth-driver of our business and has the most potential. The added benefit is that many of the emerging networks provide advantages to advertisers, such as reaching a more targeted audience, the ability to work collaboratively to develop customized content for less, and providing efficient CPMs to help offset the dizzying pricing of top-tier networks.  

Advertisers and buyers have now reached a point where they have a choice to make:  Repeat history and continue to pay higher costs for diminishing ratings, or capitalize on the growth and pricing benefits at the cable long tail to build a stronger foundation for their future media strategies. 


0 Comments

Americans Are Crazy For Digital Devices, Time Consumption Is Up

2/11/2014

0 Comments

 
Picture
by Mark Walsh, Monday, February 10, 2014

Americans own an average of four digital devices (including high-definition TVs) and spend 60 hours a week consuming media across them collectively.

“The number of digital devices and platforms available to today’s consumers has exploded in recent years. As a result, today’s consumer is more connected than ever, with more access to and deeper engagement with content and brands,” stated a Nielsen blog post today on its Digital Consumer report.

Among the key findings by category:

General device ownership and media consumption
-The majority of U.S. households now own high-definition televisions (83%), Internet-connected computers (80%) and smartphones (65%). Nearly half also own digital video recorders (49%) and gaming consoles (46%).

-Average monthly time spent using the browser and/or apps on their smartphones has also grown by nearly 10 hours, ranking second only to live television in the amount of time spent on media. Consumers have increased their monthly time spent viewing time-shifted TV content by almost two hours.

Second-screen activities
-84% of smartphone and tablet owners say they use their devices as second screens while watching TV. In addition to multitasking, they’re using smartphones and tablets to shop, look up TV show-related information and check sports scores, among other things. 

-Tablet owners are more likely to use their devices as a second screen for all of the activities examined -- with the exception of email/texting friends about the program.  

Social media activities
-Nearly two-thirds (64%) of overall social media users say they use social sites at least once a day on their computer, and almost half (47%) do so on smartphones. 

-More than half (56%) of adults ages 25-34 use social media at work. 

Mobile shopping activities
-More than four in five (87%) smartphone and tablet owners are using a mobile device for shopping activities
-Two-thirds of smartphone owners use their device to do price checks, and almost half (49%) use mobile coupons.

Hispanic connected consumers
-Latinos spend more time than the average U.S. consumer viewing video on digital devices, at more than eight hours watching online video each month -- over 90 minutes longer than the U.S. average.

-Hispanics are adopting smartphones at a higher rate than any other demographic group: nearly three in four Latinos own smartphones (72%), and half (49%) said they planned to upgrade/replace their smartphones in the next six months.

The information was compiled from various Nielsen reports, including its NetView, VideoCensus, and Mobile NetView panel data from the third quarter of 2013. TV-related data came from its national panel of TV homes and includes time-shifted viewing.

Nielsen said the Digital Consumer report is a combination of two previously separate studies: The Social Media Report and The U.S. Consumer Usage Report. It plans to issue the merged report annually.

 
"Mobile devices" photo from Shutterstock.


0 Comments

Instagram Fastest-Growing App Among Top 10 In 2013

1/21/2014

0 Comments

 
Picture
by Mark Walsh, Friday, January 17, 2014

Facebook was the No. 1 app overall in 2013, but its photo-sharing subsidiary Instagram was the fastest-growing app among the top 10.

With an average of 103.4 million unique visitors last year between January and October, Facebook had easily the largest U.S. audience of any app, with traffic up 27% from 2012. But that growth rate paled in comparison to Instagram -- acquired by the social network in 2012 for $1 billion -- which saw its app audience surge 66% to 32 million last year, according to Nielsen data.

That’s partly a result of starting from a smaller base, but the comparison with Facebook won’t do anything to dispel the growing perception that the growth in social media -- especially among teens -- is shifting to single-purpose or messaging apps, including Instagram, Snapchat, Whatsapp, Whisper and others.

Instagram also outpaced Twitter, the No. 10 app that grew 36% to 30.7 million last year. How Instagram’s growth translates into ad sales should start to become clear this year, with advertising in the app just launched at the end of 2013. In a recent research note, JPMorgan analyst Doug Anmuth suggested, however, that advertising will continue to roll out slowly on Instagram this year, not contributing significantly to Facebook’s overall revenue.

Close on Instagram’s heels in terms of growth was Apple’s Maps app (No. 8), which increased its audience 64% to nearly 32 million. That gain highlights Apple’s success in luring back irate users after its disastrous launch in iOS 6 in 2012. That isn’t to say it can match the cross-platform reach of Google Maps, which last year boasted 68.6 million uniques, reflecting 14% growth.

Indeed, Google apps -- which also include Search, Play YouTube and Gmail -- made up half the top 10 apps in 2013, pointing to the ubiquity of the Android OS. The Google platform ran on more than half (52%) of U.S. smartphones in November, according to the latest market share data from comScore.

The increase in mobile adoption overall drove down desktop traffic in 2013 compared to the prior year for each of the top 10 Web sites, according to Nielsen. Google -- the No. 1 site, with an average online audience of 164.8 million last year -- saw traffic drop 6%, while Facebook’s fell 16% to 135 million, and Yahoo’s 9% to 129.8 million.

Among the top 10, the Ask Search Network suffered the biggest decline, falling 16% to 64.2 million. YouTube, the top video site in 2013, also saw a dip in its audience -- slipping 6% from 2012 to 128.4 million, but still far ahead of No. 2 Vevo, with 37.2 million, down 9%. No. 3 video property Yahoo saw traffic fall 8% to 35.4 million. 


0 Comments

Rentrak Gets CBS' Rating, Becomes First Broadcast Net To Use It As 'Currency'

1/17/2014

0 Comments

 
Picture
by Joe Mandese, Thursday, January 16, 2014

In an important vote of confidence for the Nielsen TV ratings rival, CBS has signed a contract to begin using Rentrak’s “advanced demographics” ratings as a form of TV advertising “currency.”
The timing of the deal is significant, because it comes as Madison Avenue begins planning for the 2014-15 network upfront buying season, and when it's beginning to look like Nielsen is approaching global domination of the rest of the media audience measurement business.

While Rentrak has signed contracts with numerous agencies and broadcast groups to date, CBS is the first of the major broadcast networks to begin utilizing Rentrak's TV Essentials service as an official part of the audience data it utilizes to negotiate and guarantee advertising deals with agencies and advertisers.

The agreement, which includes a subscription for CBS’ sister network, CBS Sports Network, was described as “a major advancement” by Rentrak, which said CBS will also have access to its automotive audience data, including hourly ratings delivered against more than 230 networks and automobile make/model purchase behaviors.

“As more advertisers move beyond age/sex demographics for their media buying, there’s been a shift to combine viewing data with product-purchase data to create comprehensive evaluation tools,” stated David Poltrack, chief research officer of CBS, who has been a long-time proponent of the shift from demographics to consumer purchasing behavior data.

“Working with Rentrak, our goal is to advance this transition to a new era in television advertising execution,” he added.


0 Comments

Twitter Adds Targeting By Email Address, User IDs

1/17/2014

0 Comments

 
by Mark Walsh, Tuesday, January 14, 2014

Twitter on Tuesday announced the ability for marketers to target ads more precisely on the site using customer email addresses or users’ Twitter ID information.

The new targeting options mark an expansion of the tailored audiences program the company introduced last month for retargeting users, based on expressed interests in particular brands or categories by bringing their own or third-party data.

One of the additional ways to create audiences rolled out today allows marketers to use their own lists of customer email addresses to retarget them on Twitter or use CRM database records previously stored with an ad partner. Similar to how Custom Audiences work on Facebook, email addresses would be sent to Twitter as hashes -- unreadable alphanumeric strings -- for matching against its database to find the appropriate users.

In a blog post today, Kelton Lynn, product manager, revenue at Twitter, gave the example of a fashion retailer that wants to advertise a spring clearance sale on the site, but is opting to show the ad only to current loyalty cardholders.

The other new approach for audience targeting is to use lists of Twitter IDs -- either user names or the unique number that identifies a Twitter account -- to reach new prospects. The same fashion retailer could leverage public data on Twitter including a user’s bio, follower count, verified status or past tweets to glean specific accounts that are best suited to receive a particular ad or offer.

“The retailer would then use this list of Twitter ID’s to create a tailored audience through an ads partner, show those fashion influencers a Promoted Account and engage them as followers,” stated the post. Twitter is also allowing marketers to exclude certain CRM and user ID audiences from the set of users it wants to reach through existing targeting options tied to interests, keywords and TV.

If the retailer is running a new customer acquisition campaign aimed at Twitter users who are interested in fashion and style, it can use the loyalty cardholder audience to remove anyone who fits that interest category but is already a loyalty member.

Advertisers will continue to receive the same reports showing the number of users who viewed, clicked on or converted from an ad, without identifying individual users.

For the CRM-based ads, Twitter said it’s working with several third-party data providers -- some of whom also work with Facebook -- including Acxiom, Datalogix, Epsilon, Liveramp, Mailchimp, Merkle and Salesforce ExactTarget. The company will also allow marketers to use its Ads API to create both CRM- and Twitter ID-based audiences.

What about privacy concerns raised by the more direct targeting methods? Lynn explained in the blog post that Twitter users can uncheck the box in their privacy setting next to “Tailor ads based on information shared by ads partners,” and Twitter won’t match their accounts to information from its ads partners for tailored audiences.

Twitter also sets a minimum audience size for all tailored advertising to avoid overly specific targeting. 

0 Comments

Native Advertising Predicted To Dominate Digital In 2014

1/13/2014

0 Comments

 
Picture
by Gavin O'Malley, Thursday, January 9, 2014

Say goodbye to the stigma associated with native advertising.
 
Following The New York Times’ official embrace of the once-controversial ad format, J.P. Morgan is predicting that native will take over digital channels in 2014.
 
“We believe native ads are quickly becoming the de facto ad format on mobile and increasingly moving into desktop,” lead analyst Doug Anmuth wrote in J.P. Morgan’s annual “Nothing But Net” report, released on Thursday.
 
It is significant that Anmuth and his colleagues are tying the success of native to mobile, considering that they expect ad dollars devoted to the channel to overtake desktop dollars this year.
 
As for what makes native ads so special, J.P. Morgan calculates that they deliver a huge bang for the buck. Indeed, according to the securities firm, native ads represented just 5%-to-10% of Facebook’s impressions in 2013, but accounted for more than 60% of the company’s revenue.
 
“We think native ads also have significantly higher click-through rates than traditional display ads, which leads to higher pricing over time,” according to Anmuth.
 
But, what makes native so well-suited for the mobile medium? “Native ads are ads embedded in a [Facebook] NewsFeed or [Twitter] stream and in many cases closely resemble organic content, making them much more likely to get clicked on compared to historical banner display ads,” according to Anmuth and his team.
 
As a result, “we believe a growing interest in mobile advertising from brand advertisers coupled with improving mobile ad formats suited for smaller screen sizes should help to bridge the gap between time spent on mobile and mobile marketing spend.”
 
Moreover, “while the majority of Facebook and Twitter ad revenue is now generated through native or feed ads, we believe other publishers, such as LinkedIn and Yahoo, are also increasingly shifting inventory to the format.”
 
Last year, eMarketer predicted that the native niche would hit $2.85 billion by 2014. Yet industry thought leaders have implored publishers and brands to rethink their use of native advertising.
 
“Publishers should say ‘no,’ more than ‘yes’ to native,” Steve Rubel, executive vice president of global strategy and insights at Edelman, told attendees an the OMMA Native conference, in November. “As an industry, we’re going way too fast.”


0 Comments

Time-Shifted TV Watching Rises, Net Use Dips

12/4/2013

0 Comments

 
Picture
by Wayne Friedman, Tuesday, December 3, 2013 

Viewers watching time-shifted traditional TV continue to rise, but users of video on a computer -- as well as general computer usage -- declined in the third quarter of this year.

Users of time-shifted traditional TV have increased -- now up 11% to 167.1 million in the third quarter. This group now represents 59% of all traditional TV users, which rose slightly to 283.6 million.

Nielsen says there was a 9% decline in the number of users watching video on the Internet -- to 147.7 million on a monthly basis in the third quarter of 2013 versus the third quarter of a year ago. This comes from the latest Nielsen cross-platform media report.

The company also said the number of general users of the Internet via computer also dipped a bit -- 5% -- to 200.0 million versus the third quarter of 2012.

Mobile phone users have been going in the other direction. Analysts have said mobile and tablet usage growth will come at the expense of time spent with traditional computers.

For example, Nielsen says in the third quarter, there was a 40% rise in watching video on a mobile phone between August and October to 53.1 million users. Overall, mobile phone users rose slightly -- 1%, to 239.8 million.


0 Comments

TV Everywhere Clicks, Authenticated Video Views Soar 217%

12/4/2013

0 Comments

 
by Gavin O'Malley, Tuesday, December 3, 2013 

Since the inception of TV Everywhere, critics could confidently claim that the authentication of subscribers on non-TV devices was failing to materialize. Over the past year, however, authenticated video viewing grew 217% -- and now comprises 14% of all ad views on long-form content.
 
Clearly, the data from FreeWheel is “an indication that TV Everywhere is becoming a reality,” said Brian Dutt, manager of advisory services at FreeWheel.
 
“Over time, we expect that this will drive increased monetization of half-hour and hour-long TV programs (as well as live streams) across all screens,” Dutt said on Tuesday.
 
The data set used for its report was comprised of over 15 billion video ad views, according to the online video technology firm.

Late this year, the industry also achieved a 1:1 ratio between ad views and video views -- which, according to Dutt, indicates that monetization is finally catching up with viewing behavior. The trend is being driven by 56% year-over-year growth in long-form content with the continued movement of long-form titles into IP environments.
 
Digital pure-play publishers are utilizing pre-rolls on a larger percentage of short-form content -- up to 45% from 35% last year, according to FreeWheel.

According to Dutt, programmers are finally figuring out how to bring TV experiences to viewers across all devices and monetize at the same time. As such, the content mix is continuing to evolve with long-form growing most quickly (56%), led by scripted drama and sports.
 
The rise of mobile is also driving a massive shift in cross-channel viewing. Indeed, ad views were up 230% on mobile -- and 365% on tablets -- while the share of total ad views coming from mobile, tablet and OTT devices has tripled over the past year.
 
Also of note, the 30-second ad spot continues to gain traction across digital channels and now represents almost 50% of short-form ad views and 65% of long-form ad views.

0 Comments

Out-of-Home Ad Revenues Up Again

12/4/2013

0 Comments

 
Picture
by Erik Sass, Tuesday, December 3, 2013

 Out-of-home advertising revenues rose again in the third quarter, according to the latest figures from the Outdoor Advertising Association of America, marking 14 straight quarters of year-over-year growth since the rebound began in the second quarter of 2010.
 
Total out-of-home ad revenues grew 3.5% from around $1.55 billion in the third quarter of 2012 to $1.6 billion in the third quarter of 2013, while total revenues for the first three quarters of the year approached $5.3 billion -- up 4.4% from just under $5.1 billion during the same period of 2012.
 
In terms of categories, growth was led by miscellaneous services, restaurant, retail, insurance and real estate advertisers, while specific brands upping their budgets included AT&T, Sony Pictures, MillerCoors, Rockstar Games, Walt Disney Pictures, Microsoft, Universal Pictures, Sprint, Nissan, Geico and Blue Cross & Blue Shield.
 
The outdoor ad industry is also benefiting from continuing growth in digital out-of-home ad networks, which allow billboard owners to display multiple ads and charge by daypart, as well as enabling advertisers to adjust creative in mid-campaign.
 
Out-of-home advertising (both static and digital) is also benefiting from the rise of mobile technology, as ubiquitous smartphones allow consumers to engage with outdoor ad displays, deepening engagement with marketing messages and providing a back channel for advertisers to measure the impact of outdoor ad placements.

The last few months have seen a spate of partnerships between outdoor advertisers and mobile marketers for mobile data sharing and ad targeting.


0 Comments
<<Previous
Forward>>

    Archives

    March 2015
    February 2015
    January 2015
    December 2014
    October 2014
    June 2014
    April 2014
    March 2014
    February 2014
    January 2014
    December 2013
    November 2013
    October 2013
    September 2013
    August 2013

    Categories

    All
    Adap.tv
    Advertising
    Agencies
    Apps
    Automotive
    Branding
    Broadband
    Broadcast
    Buyers
    BuzzFeed
    Cable
    CBS
    Click-through Rates
    Comcast
    Comscore
    Consumer Expectations
    Consumption
    Cross Platform
    Demographics
    Digital
    Dish Tv
    Dual Screen
    Ecommerce
    Facebook
    Fandango
    Gaming
    Growth
    Hsi
    Instagram
    Internet
    Iptv
    Linear Tv
    Linkedin
    Measurement
    Media
    Mobile
    Mobile Tv
    Multi Screen
    Multi-Screen
    Nbc
    Ncc
    Networks
    Nielsen
    Online Video
    Ott
    Outdoor
    Out Of Home
    Out-of-Home
    Pay Tv
    Pointroll
    Print
    Prospecting
    Radio
    Ratings
    Rentrak
    Search
    Sem
    Seo
    Social Media
    Sony
    Spending
    Streaming
    Streaming Tv
    Telco
    Television
    Time Shifted
    TV
    Tv Everywhere
    Twitter
    Viacom
    Video
    Video Ads
    Viewing
    Vod
    X1 Platform
    Xfinity
    Yahoo
    Yelp
    YouTube

    RSS Feed

All rights reserved by Multi-Platform Mastermind LLC
                About Us         |        Subscribe to Newsletter